Hi! This is Ridge-i research and in today's article, Motaz Sabri will share with us some of our analysis and insights over Spherical Convolutions. When it comes to 2D plane image understanding, Convolutional Neural Networks (CNNs) will be the favorite choice for designing a learning model. However, with the advances in imagery, new formats of data such as spherical images are introduced, adding new demand for more complex analysis tools. Those new data formats are essential in our daily lives such as an omnidirectional vision for autonomous cars, global weather, and climate modeling. Applying the standard CNN techniques will not be effective because of the space-varying distortions introduced by such projection and will cripple the translational weight sharing. A newly introduced spherical CNNs building block is the main alternative as seen in Figure 1. It is hypothesized that the spherical correlation satisfies a generalized Fourier theorem, which allows an efficient computation using a generalized Fast Fourier Transform (FFT) algorithm. We discuss equivariant representations yield from these hypotheses and the advantages and disadvantages of using a graph representation of the sample sphere. We also analyze their effect on the equivariance by the underlying graph with respect to the number of vertices and neighbors.

Background
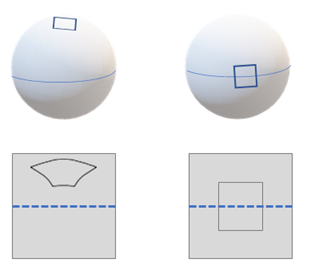
It is within the abilities of the Convolutional network to detect spatial patterns regardless of their position in the image. Patterns on the Equirectangular data can also have different positions however the nature of the movement, in this case, is a 3D rotation instead of a translation. Standard CNN models are unable to just project the image on the sphere onto a plane because the regions would be immensely distorted. This can be seen by the illustration proposed in Cohen, T.S. et. al [1] work in the Figure 2. We see that a region in the sphere to the right would produce what looks like a square when projected onto a plane. That same region on the same sphere where the sphere is oriented differently – as seen on the sphere at the left, can be hardly traced back to a square. it is a challenge for a traditional 2D CNN to detect regions on a spherical image.
There is no symmetrical grid that can fit a sphere, unlike the plane case. This emphasizes the need not to consider every pixel on a sphere individually [2]. On the other hand, if we consider all possible views – or rotations- then this would leave us with a problem with large complexity, which leads to computational inefficiency [3].
The local Euclidean property of the sphere was exploited early in this direction of research [4,5]. However, those exploitations were not equivariant to rotations. On the other side of this tradeoff, Cohen et. al [1] and Esteves et al. [6] proposed to perform proper spherical convolutions through the spherical harmonic transform. The formers are computationally expensive due to their rotation equivariance. Cohen et al. [7] proposed a sphere to icosahedron downsampling to minimize the computational costs. This limited the size of the representation of the symmetry group however introduced distortions by this projection that hinders performance. A trending research direction represents the sphere as a weighted graph by connecting its pixels according to the distance between them. It drastically minimizes the computation while maintaining accuracy [8, 9, 10]. In the following sections, we further analyze the graph-based spherical CNNs showing its controllable tradeoff between cost and equivariance. We will also share our experimental results on multiple problems of practical interest. We will also show the competitiveness and flexibility of this approach.
Graph based spherical neural network
In this section, we discuss graph-based spherical neural networks.
Also, check out the following article on the application of graph machine learning in healthcare.
Theory
We analyze the graph-based representation of spheres proposed in [4] through computational efficiency, sampling flexibility, rotation equivariance. The key concept in this proposal is to model the sampled sphere as a graph of connected pixels using the geodesic distance between two pixels. This applies strict control over the local support of filters as proposed in [11]. It is computationally more efficient as it avoids an explicit use of the Graph Fourier basis. The proposed design is rotation equivariant while remaining computationally inexpensive. The graph convolution can be performed with a weighted average of neighboring pixels. This helps in avoiding computing Fourier transforms and obtain an operation with complexity linear to the data size.
Figure 3 shows the neural network architecture that was designed to help to process spherical data. It uses Hierarchical Equal Area isoLatitude Pixelation (HealPix) for sampling. It means that the pixelation produces a subdivision of a spherical surface in which each pixel covers the same surface area as every other pixel. Such sampling allows each point to corresponding to a surface of the same area and comes with a natural pooling operation. As graphs are dynamic by nature, the approach can be adapted to almost any sampling. It is observed that graphs were already used similarly in [12]. An interesting observation is that it becomes trivial to only use a sub-region of the sphere when using graphs. This is useful when it comes to processing partial regions which is common in space data.

Mathematical model
Given a connected, undirected, weighted graph and degree matrix
with zeros except for diagonals, which are sums of weights of edges incident to the corresponding node, then the none-normalized Laplacian is given as
and the complete set of Fourier basis is
and the associated real non-negative eigenvalues are
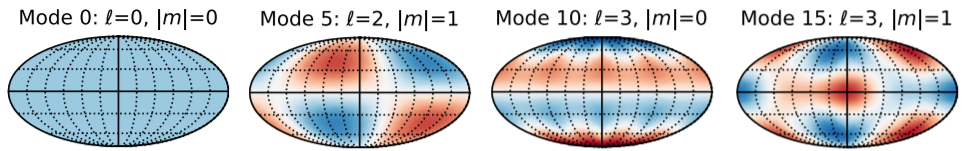
Figure 4 shows a sample of the graph basis on a sphere using HEALpix sampling:
Let us define the coevolution on a given graph:
If the Fourier transform is and then its inverse is
, therefore, the multiplication in the Fourier domain will equal to
where represents the inverse of the Fourier transformation,
represents the Fourier transformation and
represents the multiplication with filters, all nodes share the same kernel. We observed the empirical alignment of Fourier basis confirmed the convergence towards Laplace-Beltrami operator as mentioned in [4]. This shows the sphere equivariant property and the results can be seen in Figure 5:

The equivariant property and the speed is Reverse fitting, in which the number of vertices in a graph causes an increase in edges and their increase improves the equivariant property but reduces the speed. It can be also observed that the graph convolution cost is while the spherical convoluting as observed in [4,11] is
.
Applications
Here, we introduce the following three applications:
- Localization
- Segmentation
- Forecasting
Localization
Graph-based learning can enhance the performance of sphere-based networks in the localization and classification tasks [13,14,15]. It encodes invariance against such distortions explicitly into convolutional neural networks. It can adapt the sampling locations of the convolutional filters, effectively reversing distortions, and wraps the filters around the sphere. This enables the transfer of existing perspective convolutional neural network models to the omnidirectional case. Evaluation of the object detection and localization against flying cars dataset [13] that was prepared using 360 omnidirectional data rendered 3D models from shapenet [14] from is shown in Figure 6:

Segmentation
Following the unstructured grids approach in [14] and using parameterized differential operators for spherical signals, the graph-based model and kernel parameterization achieves competitive accuracy with significantly fewer network parameters. We used the data proposed in [17] and processed as guided here. Results for segmentation on spherical data can be seen in Figure 7.

Forecasting
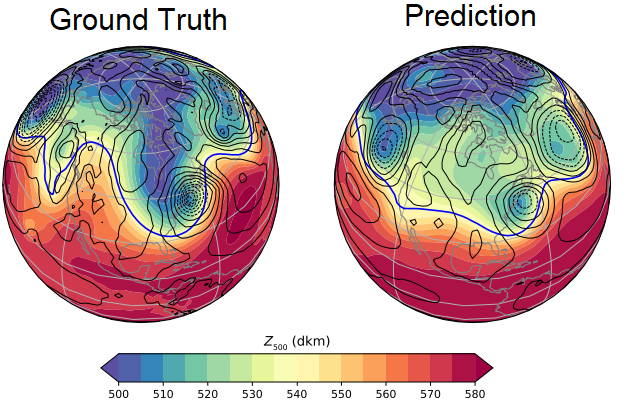
Using the cubed volume conservative mapping [15] to graph-based sphere model over multiple steps improves prediction sequence for weather forecast. This remapping minimizes the distortion on the cube faces on which convolution operations are performed and provides natural boundary conditions for padding in the CNN. We evaluated the proposal using the deep learning weather prediction datasets that is processed using instructions here [18]. Figure 8 shows one sample (ground truth at the left and prediction at right) for a forecast over 642 hours out using the Z500 information.
Conclusion
The graph-based spherical neural network achieves a robust balance between desiderata for a spherical CNN. The number of neighbors that every pixel is connected to in the graph, controls the tradeoff between cost and equivariance. As computational cost and memory consumption scales linearly with the number of pixels. It has many scientific applications due to its flexible representation. A potential drawback of graph Laplacian-based approaches is possibly the reduction of the expressive power of the neural network due to the isotropy of graph filters. As suggested in [4 ,11], more general convolutions achieve better performance. Developing graph convolutions on irregular samplings that respect the geometry of the sphere is an interesting extension for this research direction.
さいごに
Ridge-iでは様々なポジションで積極採用中です. カジュアル面談も可能ですので,ご興味がある方は是非ご連絡ください.
References
- Cohen, T.S., Geiger, M., Khler, J., Welling, M.: Spherical CNNs. In: International Conference on Learning Representations. (2018)
- G.S. Chirikjian and A.B. Kyatkin. Engineering Applications of Noncommutative Harmonic Analysis. CRC Press, 1 edition. (2001)
- G.B. Folland. A Course in Abstract Harmonic Analysis. CRC Press. (1995)
- Michael Defferrard, Martino Milani, Frederick Gusset, and ´ Nathanael Perraudin. Deepsphere: a graph-based spherical CNN. In 8th International Conference on Learning Representations, ICLR (2020).
- Wouter Boomsma and Jes Frellsen. Spherical convolutions and their application in molecular modelling. In Advances in Neural Information Processing Systems, (2017).
- Yu-Chuan Su and Kristen Grauman. Learning spherical convolution for fast features from 360 imagery. In Advances in Neural Information Processing Systems, (2017).
- Carlos Esteves, Christine Allen-Blanchette, Ameesh Makadia, and Kostas Daniilidis. Learning so(3) equivariant representations with spherical cnns. In Proceedings of the European Conference on Computer Vision (ECCV), (2018).
- Taco S. Cohen, Maurice Weiler, Berkay Kicanaoglu, and Max Welling. Gauge equivariant convolutional networks and the icosahedral cnn. In International Conference on Machine Learning (ICML), (2019).
- Joan Bruna, Wojciech Zaremba, Arthur Szlam, and Yann LeCun. Spectral networks and locally connected networks on graphs. arXiv:1312.6203, (2013).
- Renata Khasanova and Pascal Frossard. Graph-based classification of omnidirectional images. In Proceedings of the IEEE International Conference on Computer Vision, (2017).
- Nathanael Perraudin, Michael Defferrard, Tomasz Kacprzak, and Raphael Sgier. Deepsphere: Efficient spherical convolutional neural network with healpix sampling for cosmological applications. Astronomy and Computing, (2019).
- Michael Defferrard, Xavier Bresson, and Pierre Vandergheynst. Convolutional neural networks on graphs with fast localized spectral filtering. In Advances in Neural Information ProcessingSystems, (2016).
- Khasanova, R., & Frossard, P. Graph-based classification of omnidirectional images. In IEEE International Conference on Computer Vision Workshops. (2017).
- Chang, A.X., Funkhouser, T.A., Guibas, L.J., Hanrahan, P., Huang, Q., Li, Z., Savarese, S., Savva, M., Song, S., Su, H., Xiao, J., Yi, L., Yu, F.: Shapenet: An information-rich 3d model repository. arXiv.org 1512.03012, (2015).
- C . M . Jiang, J. Huang, K. Kashinath, Prabhat, P. Marcus, M. Niessner, Spherical CNNs on unstructured grids, in: International Conference on Learning Representations, (2019).
- Hwang, J., Orenstein, P., Cohen, J., Pfeiffer, K., & Mackey, L. Improving subseasonal forecasting in the western U.S. With machine learning. In Proceedings of the acm sigkdd international conference on knowledge discovery and data mining, (2019).
- Armeni, S. Sax, A. R. Zamir, and S. Savarese. Joint 2d-3dsemantic data for indoor scene understanding, (2017).
- Weyn, J. A., Durran, D. R., & Caruana, R. . Can machines learn to predict weather? Using deep learning to predict gridded 500‐hPa geopotential height from historical weather data. Journal of Advances in Modeling Earth Systems, (2019).